Meta Platforms: Could Be The Most Undervalued Technology Co. (META)
")
Justin Sullivan
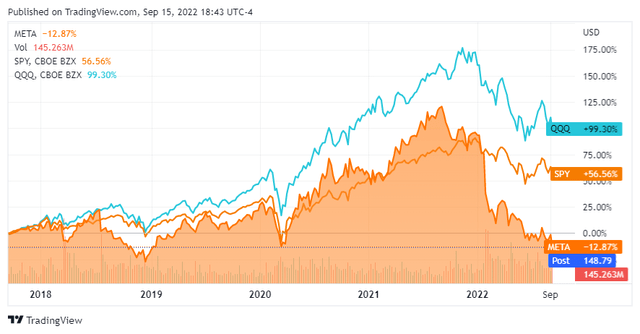
Despite increasing its revenue by $78.76 billion (193.73%), gross profit by $60.9 billion (173%), cash from operations by $34.25 billion (141.44%), Free Cash Flow (FCF) by $18.35 billion (104.94%), and net income by $17.72 billion (111.32%) over the prior 5 fiscal years, Meta Platforms (NASDAQ:META) is trading well below the $176.46 per share it closed 2017 with. Over the past year, META has declined by -59.88%, and YTD has fallen well below the major indices, declining -55.71%. I am asking myself if META is a broken company or a broken stock? I believe META is a quintessential example of a mispriced stock in the market. There are countless aspects that impact a company’s stock price, but looking past perceptions and opinions, the numbers indicate that META is inaccurately valued. Unless financial fraud is occurring, the numbers disclosed on 10Q and 10K reports cannot be manipulated. $1 of revenue and $1 of profit is still $1 of revenue and $1 of profit regardless of which industry a company operates in. If a company’s revenue grows from $100 to $150, it doesn’t matter if it’s a technology company or a pharmaceutical company; the growth rate is 50%. My feelings are that too many people are disregarding the Metaverse and using it as a narrative as to why META has lost its way, causing negative perception and uncertainty in its stock. At the end of the day, the numbers are the numbers, and META’s shares should be trading at a minimum of 80% higher.
Seeking Alpha
The numbers are the numbers, and META is not being valued on what they are accomplishing
The mentality of buying companies that make things and produce consumer staples during inflationary times needs to be replaced with investing in great companies with solid balance sheets that produce large amounts of profits. Unfortunately, out of all the valuation metrics, there isn’t one that is looked at the same way throughout different industries. My opinion is that it’s a tie between META and Alphabet (GOOGL) as to which company has the strongest balance sheet in the entire market. Some would say GOOGL as it has more assets, cash, and equity, but there are many similarities between the two. META has $0 in long-term debt, and its cash position of $40.49 billion is 92% of its total liabilities, which includes capital leases. META isn’t a profitless tech company, yet its shares have plummeted more than -50% in 2022.
It is astonishing how investors can justify paying double the Price to Free Cash Flow (FCF) multiple for The Coca-Cola Company (KO) than META, when META produces more than double the amount of FCF, and profits. The Price to FCF metric is a longtime favorite of mine that has recently become popular as FCF has become important again. FCF is often looked at as one of the best measures of profitability as FCF excludes the non-cash expenses of the income statement and includes spending on equipment and assets as well as changes in working capital from the balance sheet. To some investors, FCF is more important to analyze than net income because it’s harder to manipulate as it is a true indication of the company’s cash. FCF is also the pool of capital that companies can utilize to repay debt, pay dividends, buy back shares, make acquisitions, or reinvest in the business. With every investment, you’re paying the current value for a company’s present and future cash flow. More commentators on financial networks have discussed the importance of generating FCF in the past 6 months than in the past 3 years.
I will go through META’s financials, but to show how undervalued its shares are, I will compare META to 10 other companies. I am selecting companies from big tech and consumer staples to show the level of FCF produced in different industries and the price to FCF multiple for each company. This comparison will show that the methodology of investing in companies that produce things should be updated to investing in companies that produce strong cash flow, regardless of the industry they operate in. The companies I will compare META to are:
- Apple (AAPL)
- Microsoft (MSFT)
- Amazon (AMZN)
- Alphabet (GOOGL)
- Tesla (TSLA)
- Procter & Gamble (PG)
- The Coca-Cola Company (KO)
- Kimberly-Clark (KMB)
- McDonald’s (MCD)
- PepsiCo (PEP)
In addition to adding the disclosure at the end, I want to be clear prior to the analysis that I am a shareholder of AAPL, AMZN, GOOGL, META, TSLA, and KO. The numbers are the numbers and cannot be manipulated, and I am not cherry-picking information. I will be using the FCF over the TTM as the amount of FCF produced, not a projected Forward FCF number.
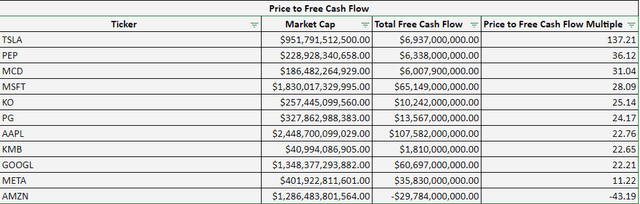
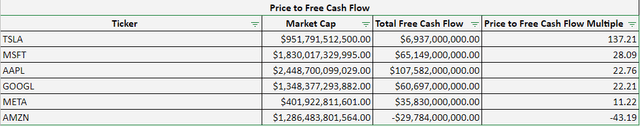
Below is a table of the price to FCF multiple Mr. Market has placed on each of these companies at the close of business on 9/15.
Seeking Alpha, Steven Fiorillo
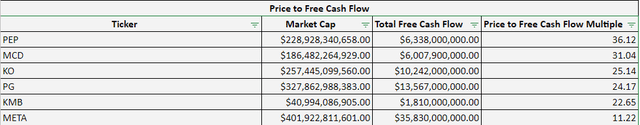
First, I will start by comparing META to the consumer staples companies I selected. The average price to FCF across PEP, MCD, KO, PG, and KMB is 27.82x. These companies have an average market cap of $208.34 billion and generate an average of $7.59 billion of FCF. PG is the largest company in this group, with a market cap of $327.86 billion, generating $13.57 billion in FCF, with a price to FCF multiple of 24.17x. KMB has the lowest FCF multiple of 22.65x and generated $1.8 billion of FCF in the TTM.
Seeking Alpha, Steven Fiorillo
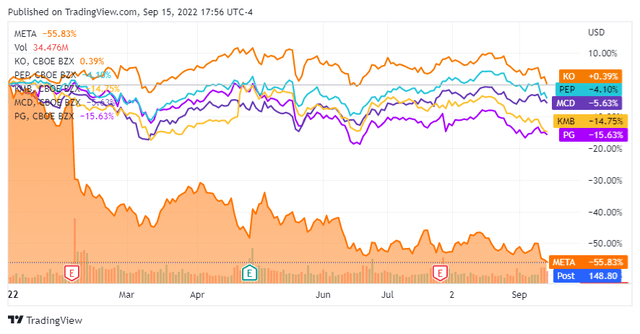
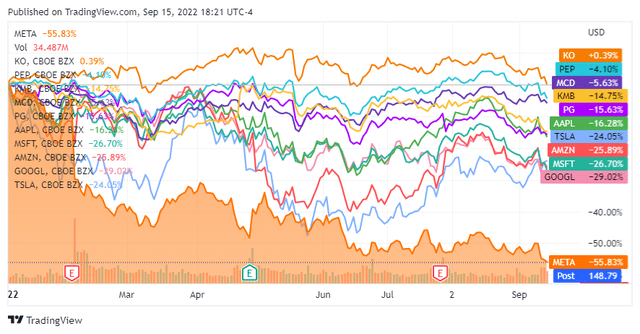
When I compare META to these companies, META’s share price has fallen off a cliff while these consumer staples have a range of appreciating by 0.39% to declining by -15.63%. They have been safer investments, providing better downside risk mitigation while paying quarterly dividends to shareholders.
Here is where valuations get interesting. KMB has a market cap of $40.99 billion, generated $1.81 billion of FCF, and trades at a price to FCF multiple of 22.65x. META’s market cap is 9.8x larger than KMB, yet it produces 19.8x the amount of FCF than KMB. You can purchase shares of META for a price to FCF multiple of 11.22x, which is slightly less than half the multiple Mr. Market has given KMB at 22.65x. The valuations do not make sense. If you were buying an entire company, would you rather purchase KMB for $40.99 billion when it generates $1.81 billion of FCF or META for $401.92 billion when it generates $35.83 billion in FCF? I would rather buy META at 9.8x the price tag to generate 19.8x more FCF, especially since I am paying a multiple of 11.22x for its FCF.
If I look at PG instead, PG has a similar market cap to META at $327.86 billion and produces $13.57 billion of FCF. PG is currently trading at a price to FCF multiple of 24.17x. This valuation also doesn’t make sense as META is priced at a price-to-FCF ratio that is 53.58% less than PG’s. META’s market cap is only 22.59% larger than PG’s, yet it generates 264.1% more FCF than PG. For an additional $74.06 billion (22.59% larger), you could buy the entire company of META and generate an additional $22.26 billion of annual FCF.
Looking at the most expensive staple, PEP, the valuations become even more unrealistic. PEP has generated $6.34 billion of FCF in the TTM and trades at a price to FCF multiple of 36.12x. FB has a market cap that’s 75.57% larger than PEP, yet it produces 565.32% more FCF than PEP. The market has placed a multiple of more than 3x PEP’s FCF on its price compared to how META trades.
These examples are to illustrate how the market values different types of companies. At the end of the day, the numbers and the numbers, and $1 of FCF is $1 of FCF, it doesn’t matter if you’re selling Tide laundry detergent, a can of Pepsi, or ads on Facebook. META generates tens of billions more in FCF than these consumer staples and trades at a fraction of the valuation, which in my opinion, is an indication that META is grossly misvalued in the market.
Seeking Alpha
Seeking Alpha, Steven Fiorillo
I wanted to compare META to consumer staple companies first because media commentators have been discussing allocating capital toward defensive companies, which has traditionally meant consumer staples. I believe cash is king and the combination of companies with growing revenues, large profits, large FCF, and clean balance sheets is where capital should be allocated to regardless of the economic environment.
When I look at META compared to the other large tech companies, META once again looks undervalued. The goal in business is to generate a profit, and AMZN has been operating at a negative FCF and low-profit margin in the TTM, yet its market cap vastly overshadows META’s. In the TTM, AMZN has generated $11.61 billion in net income compared to META’s $33.63 billion of net income, yet its market cap is more than 3x the size. AMZN has also generated $35.57 billion of cash from operations in the TTM, placing its FCF at -$29.78 billion as they have allocated $65.36 billion toward CapEx. AMZN has a profit margin of 2.39% compared to META’s 28.16%. Looking at AMZN’s negative FCF, and low-profit margin, it’s hard to justify META’s 11.22x price to FCF.
The market has loved TSLA, and its market cap is on the verge of surpassing $1 trillion. Currently, TSLA has produced $6.94 billion in FCF and trades at a price to FCF multiple of 137.21x. Many investors would say you need to look at TSLA’s growth, so I did. Since the close of 2018, TSLA has grown its revenue by $45.71 billion (212.97%) while META has grown its revenue by $63.57 billion (113.85%). While TSLA’s growth rate is larger, META has grown its revenue by a significantly larger amount in the same period. Looking at net income, TSLA has grown its net income by $10.5 billion to $9.52 billion since the close of 2018, while META has grown its net income by $11.52 billion to $33.63 billion in the same period. When I look at the growth of TSLA, it’s impressive, and TSLA is doing so many things well, but the valuation is broken. TSLA trading at 137.21x its FCF compared to META at 11.22x is, in my opinion, an indication that META is undervalued. Would you rather buy a company for $951.79 billion that produces $6.94 billion in FCF, or a company for $401.92 billion, producing $35.83 billion of FCF?
Seeking Alpha
Even if the Metaverse is a flop, META is paying for its development in cash, isn’t taking on debt, and shouldn’t be penalized because others can’t understand Zuckerberg’s vision
One of the reasons I believe META has been discarded is that many investors don’t agree with META’s play on the Metaverse. Whether the Metaverse will work or become mainstream is a debate that can’t be won at this point in time, and we will need to wait and see how the story unfolds. The aspect that can be discussed is how the Metaverse is impacting META’s numbers and whether it is a liability.
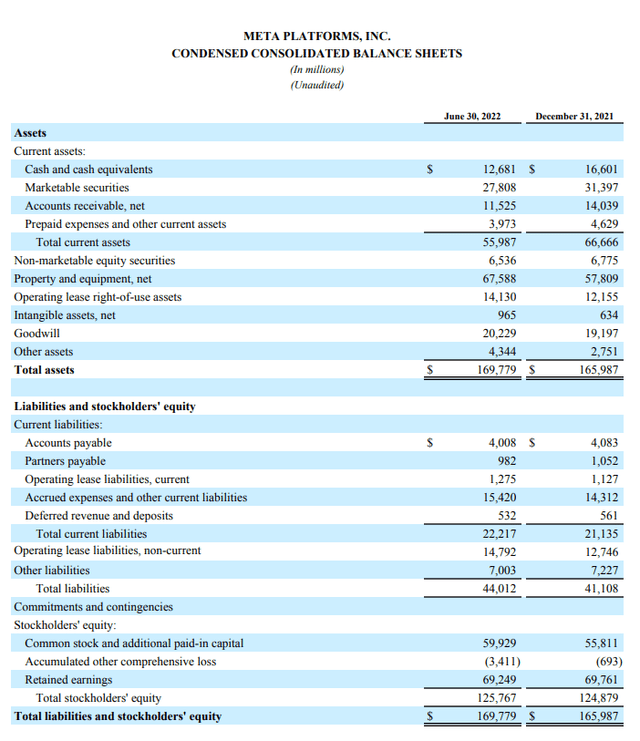
Meta Platforms
As I indicated earlier, META has one of the cleanest balance sheets you will ever read. Debt is not in META’s vocabulary, as long-term debt will not be found on its balance sheet. META has a cash-to-total liability ratio of 0.92x and can pay off almost every liability tomorrow with a check. Debating if the Metaverse will work is a moot point because, in the end, it doesn’t matter. META isn’t taking on debt to fund this project, so if it doesn’t work, it will be chalked up as an expensive failed experiment, but if it is successful, the Metaverse could become a tremendous revenue generator and profit center. While billions in capital are being spent on the Metaverse, META has also been buying back shares. Over the previous 4 years, META has repurchased 5.37% of its outstanding shares, which amounts to 166.5 million shares.
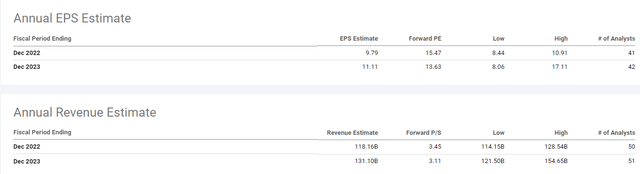
Looking forward, META is expected to continue to grow in 2023. In the TTM META has generated $119.41 billion of revenue and produced $12.22 in EPS. The consensus estimates are that META will generate $118.16 billion of revenue in 2022 and $131.1 billion in 2023, and on the high side, those numbers could be $128.54 billion in 2022 and $154.65 billion in 2023.
Seeking Alpha
META and GOOGL have a duopoly on advertising, and regardless of what AMZN, AAPL, or Netflix (NFLX) plans to incorporate into their platforms, it’s hard to run a business without a website, Instagram page, or a Facebook page. If META maintains its profit margin of 28.16%, it could generate $33.28 billion of net income in 2022 based on the analyst consensus and $36.92 billion in 2023. If META exceeds expectations, it could generate over $35 billion of profit in 2022 and $40 billion in 2023. META is being priced as if a fire sale is occurring, and I believe it’s due to public perception, not the numbers.
Conclusion
The markets may continue to be extremely volatile going into the next Fed meeting, and there is no telling how the markets will react if we receive a 75 basis point increase. META is trading where it did in 2017, yet it’s improved in every financial metric and printed tens of billions in profits and FCF annually. While there are no signals that the pain is over, I am continuing to purchase META on the way down. META’s current valuation and financials indicate that this is a broken stock, not a broken company. From a numbers standpoint, META looks to be the best buy in big tech and possibly one of the best buys in the market if you have a long-term perspective.

:quality(70):focal(544x1110:554x1120)/cloudfront-eu-central-1.images.arcpublishing.com/businessoffashion/3STVJF35L5GVHDL5SP7D4BXBU4.jpg "Can Engineering Establish a Superior Current market for Fashion’s Unused Fabrics?")


